Quick Start
This quick start shows how to build and run a simple first-order low-pass
filter with pySimBlocks, first with the Python API and then with the
graphical editor.
Python API example
The following example models a simple first-order low-pass filter defined by:
\[
y[k] = \alpha x[k] + (1-\alpha) y[k-1]
\]
examples/quick_start/filter.py
from pySimBlocks import Model, Simulator, SimulationConfig, PlotConfig
from pySimBlocks.blocks.operators import Gain, Sum, Delay
from pySimBlocks.blocks.sources import WhiteNoise
from pySimBlocks.project.plot_from_config import plot_from_config
# 1. Create the blocks
noise = WhiteNoise(name="noise", std=1.0)
delay = Delay(name="delay")
filtered = Sum("filtered", signs="++")
alpha_gain = Gain(name="alpha", gain=0.1)
complement = Gain(name="complement", gain=0.9)
# 2. Build the model
model = Model("Example")
for block in [noise, delay, filtered, alpha_gain, complement]:
model.add_block(block)
model.connect("noise", "out", "alpha", "in")
model.connect("delay", "out", "complement", "in")
model.connect("alpha", "out", "filtered", "in1")
model.connect("complement", "out", "filtered", "in2")
model.connect("filtered", "out", "delay", "in")
# 3. Simulate the model
sim_cfg = SimulationConfig(dt=0.05, T=30.)
sim = Simulator(model, sim_cfg)
logs = sim.run(logging=["noise.outputs.out", "filtered.outputs.out"])
# 4. Plot the results
plot_cfg = PlotConfig([
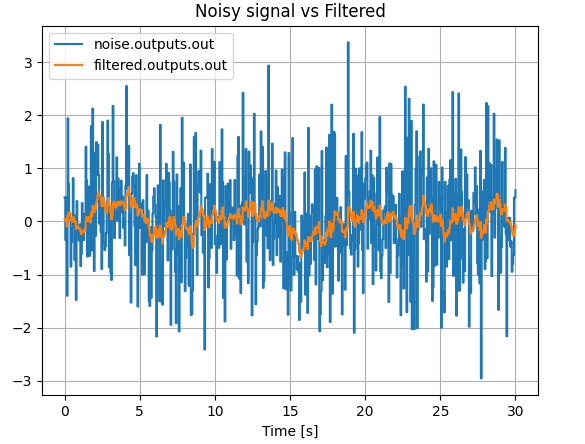
{"title": "Noisy signal vs Filtered",
"signals": ["noise.outputs.out", "filtered.outputs.out"],},
])
plot_from_config(logs, plot_cfg)
The resulting plot should look like this:
Graphical editor
The same model can also be created visually with the graphical editor.
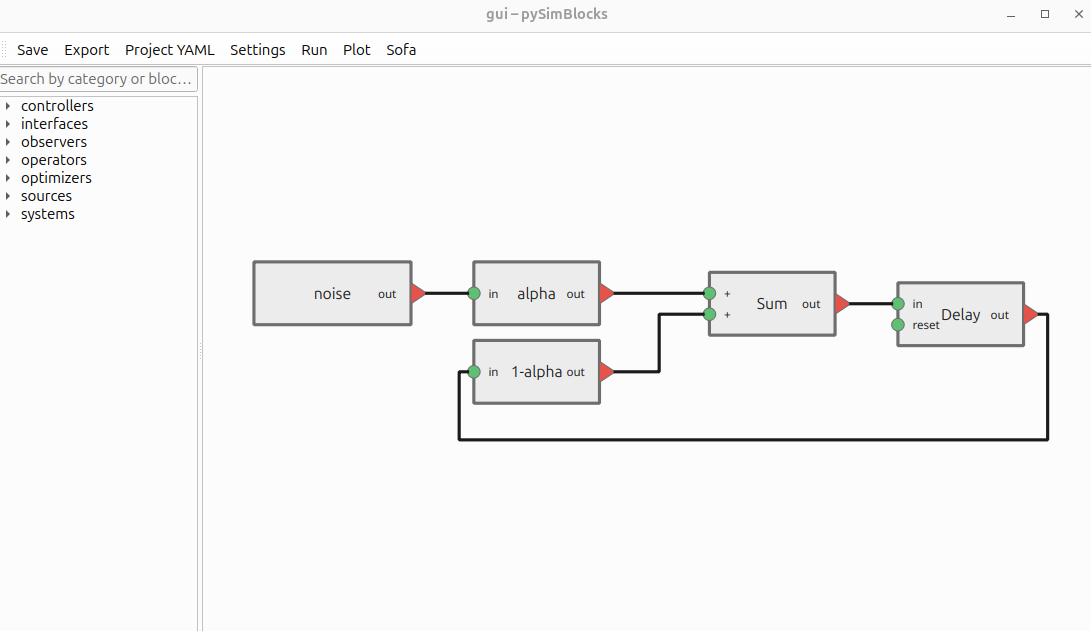
To open the graphical editor with the quick-start project:
pysimblocks gui examples/quick_start/gui
Downloads
You can download or view the quick-start example files here:
If you have cloned the repository, the files are in examples/quick_start/.