Tutorial 2: Building a Model with the GUI
In this tutorial, we rebuild the same closed-loop system as in Tutorial 1, but using the graphical editor.
Goals
The objective is to:
Add blocks visually
Configure their parameters
Connect signals
Run the simulation
Save and export the project
By the end of this tutorial, you will be able to build and simulate your own block-based model with the GUI.
System Reminder
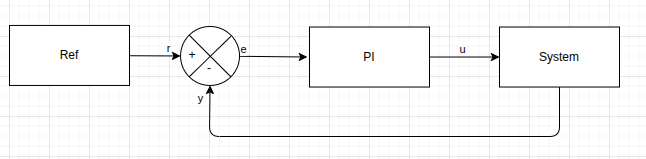
We build a simple closed-loop control system composed of three elements:
A step reference
A PI controller
A first-order discrete-time linear plant
Step-by-Step Construction
Create a New Project
Create a new project folder and start the GUI:
mkdir tutorial-gui
cd tutorial-gui
pysimblocks gui
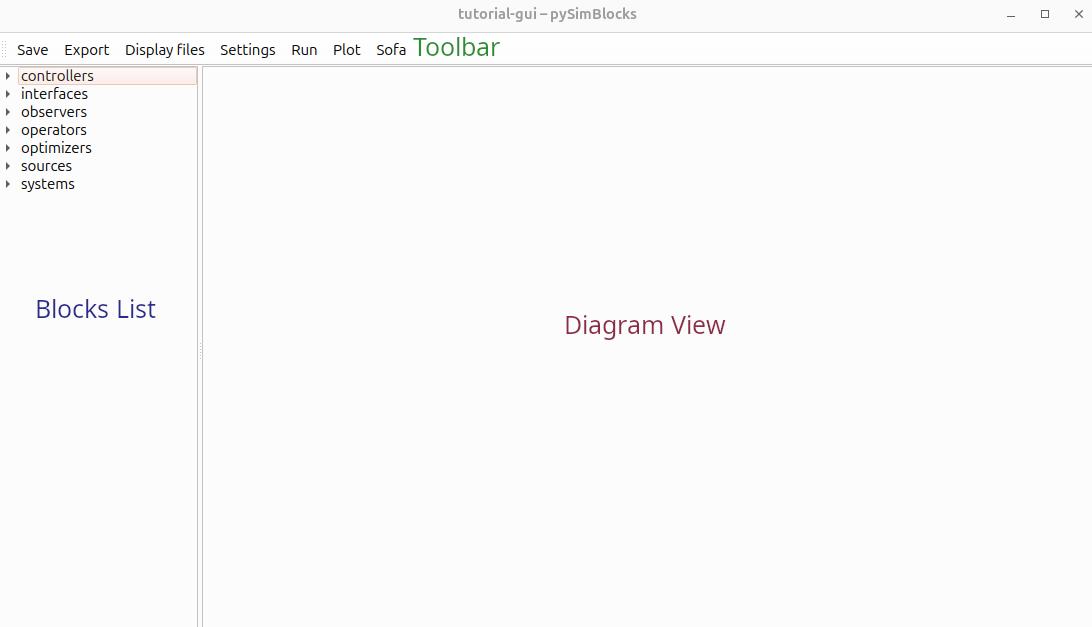
The main window opens, with the toolbar at the top, the block list on the left, and the diagram view on the right.
Add the Blocks
Add the required blocks to the diagram:
Double-click a category in the block list to expand it.
Drag the selected block into the diagram view.
Repeat this for all required blocks and arrange them on the canvas.
Notes:
Press
Spacein the diagram view to center the view on all blocks.Select a block and press
Ctrl+Rto rotate it.
Connect the Blocks
Input ports are represented by circles and output ports by triangles.
To create a connection, select a port and drag the connection to the target port. While dragging, a dashed line appears. The line becomes solid once the connection is valid.
The ports must be of different types: output to input.
Configure the Parameters
Configure both the blocks and the simulation settings.
Block Parameters
Open a block dialog by double-clicking the block.
Set the following parameters:
Block |
Parameter |
Value |
|---|---|---|
LinearStateSpace |
A |
0.9 |
LinearStateSpace |
B |
0.5 |
LinearStateSpace |
C |
1.0 |
LinearStateSpace |
x0 |
0. |
PID |
controller |
PI |
PID |
Kp |
0.5 |
PID |
Ki |
2. |
Sum |
signs |
+- |
If you rename the blocks, use the same names as in
Tutorial 1: ref, error, PID, and system.
Notes:
Scalars are represented as
(1,1)arrays.You can define vectors or matrices with Python-like nested lists such as
[[0.5], [0.3]].Use the Help button for a description of the selected block.
Simulation Settings
Open the simulation settings from the toolbar and configure:
Sample time:
0.01sDuration:
5sSignals to log:
system.outputs.y,PID.outputs.u, andref.outputs.out
You can also define custom plots in the plots panel for quick access after the simulation.
Click Apply before switching panels, otherwise the changes are not saved.
Run the Simulation and Visualize the Results
Once all parameters are configured, run the simulation with the toolbar run button.
Then open the plot dialog to either:
Plot selected logged signals in a single graph
Open one of your predefined plots
Under the hood, the GUI generates the same Model structure used in
Tutorial 1. The execution engine is the same.
Save and Export Project Files
Save the Project
Saving from the toolbar creates a project.yaml file in the current folder.
This file contains:
Project metadata
Simulation settings
Block diagram data
GUI layout information
This single file fully describes the model and can be reloaded in the GUI or executed programmatically.
Export a Python Runner
The Export button generates a run.py file.
This script loads project.yaml, rebuilds the corresponding Model, and runs
the simulation from the command line:
python run.py
Example File
If you want to compare your result with a completed version, you can download or view the project files here:
If you have cloned the repository, the full reference project lives in
examples/tutorials/tutorial_2_gui/.
Comparison with the Python Version
The system built in this tutorial is identical to the one created manually in Tutorial 1.
In the Python version:
Blocks are instantiated in code
Connections are created with
model.connect(...)The simulator is built directly
In the GUI version:
The diagram is created visually
The configuration is stored as YAML
Export generates a Python runner from that configuration
In both cases, the execution engine is the same.
Try It Yourself
Experiment with the model to better understand the GUI workflow:
Modify the controller gains
KpandKiChange the system dynamics
AandBAdjust the sample time or simulation duration
Create additional custom plots
Rename blocks and reorganize the layout
After modifying the model, save the project and export a new run.py file to
verify that the exported script reproduces the same behavior.